
Category: Data
Weekend reading: Friday, March 10, 2017
I, like many of you, catch up on news over morning coffee on the weekend. Starting today, I’m going to post some of the more interesting data-related stories that I found both interesting and helpful in my …
The post Weekend reading: Friday, March 10, 2017 appeared first on DataGravity Blog.
Research: Xerox Printers Beaconing Out To The Internet
 While conducting some research, I happened to notice a rather odd domain name that a particular server was beaconing out to. The domain in question was xeroxdiscoverysupernode3.com. Initially, I figured that the domain could be malware or phishing related as the likelihood of Xerox Corporation using such a long domain was relatively low. Upon further investigation, the xeroxdiscoverysupernode3 domain wasn’t even registered. Could a piece of malware have been constructed to call out to this specific domain to download additional files? Why wouldn’t the malware author register the domain ahead of time if that was the plan?
As this domain ended in the number 3, I pondered the idea of there being a ’1′, ’2′, or maybe even a ’4′ numbered domain that followed this same pattern. It turned out that xeroxdiscoverysupernode1, xeroxdiscoverysupernode2, and xeroxdiscoverysupernode3 were actively being queried for within the OpenDNS global infrastructure. Not only were the domains being queried, but each was receiving roughly 2,000 queries per hour (as seen below).
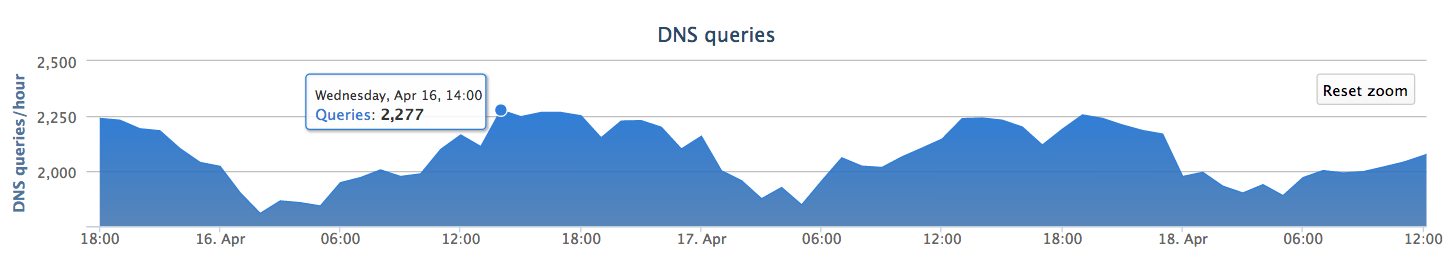
The plot thickens…
The full post can be read here: http://labs.opendns.com/2014/05/01/xerox-printer-beacons/
Photo Credit: Truthout.org via Compfight cc
Job Search Progress
Since announcing on January 11th that I was actively transitioning out of my role at CloudPassage, I’ve been quite busy. Lots of calls, emails, and onsite interviews, in addition to numerous friends and colleagues offering to help out in any way they could.
After analyzing my week, I decided to post some of the visualizations resulting from my analysis.
Figure 1 – Daily Distribution of Meetings
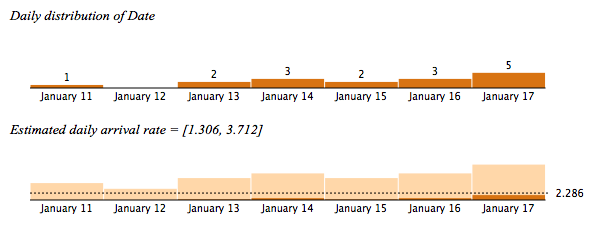
Figure 2 – Time Spent Per Company (in minutes)
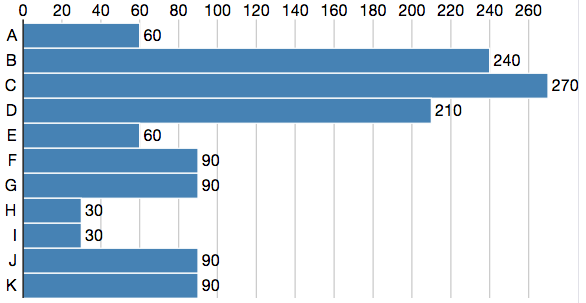
Figure 3 – Distribution of Meeting Duration (in minutes)
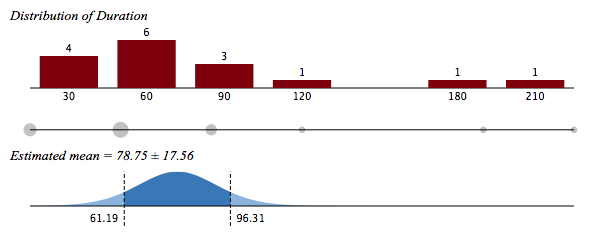
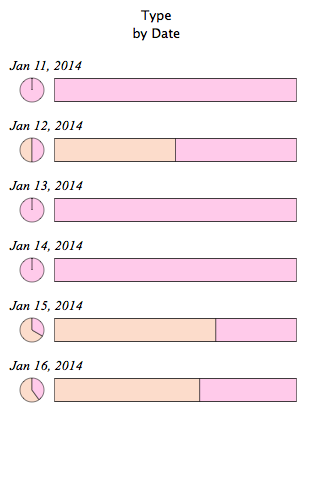
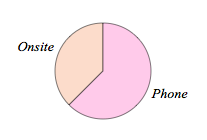
Figure 4 – Distribution of Meeting Type (by date)
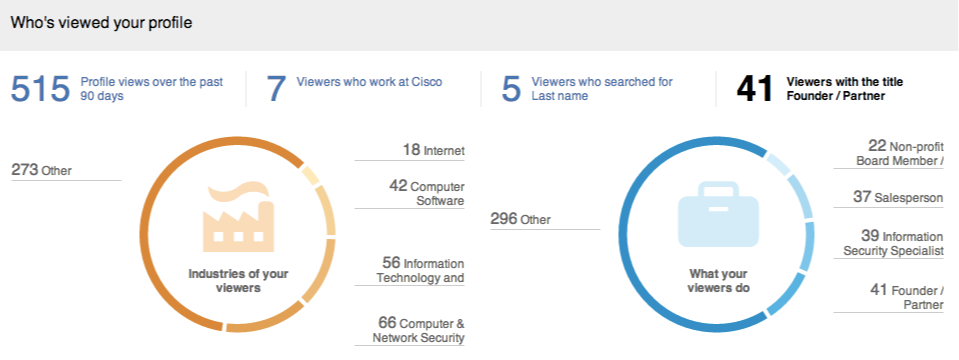
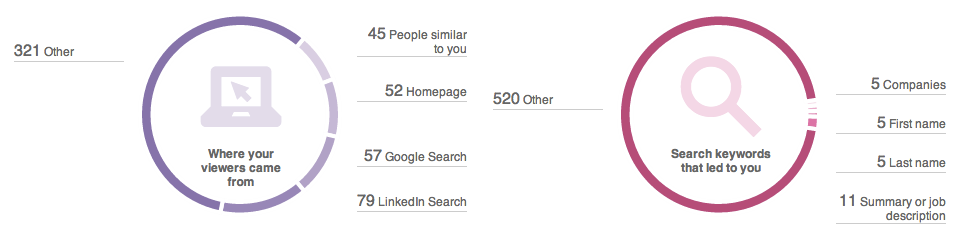
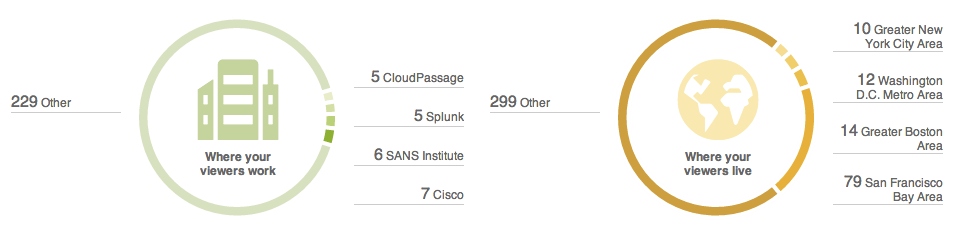
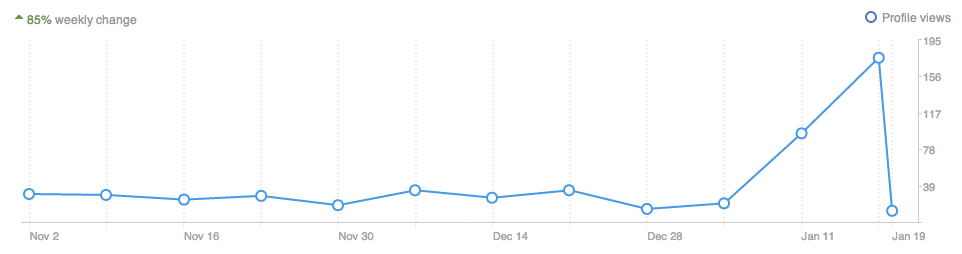
I also wanted to point out some of the statistics provided by LinkedIn around who has looked at my profie.
Figure 5 – LinkedIn Search Stats
Good progress for the first week. Let’s hope that Week 2 is just as busy 🙂